
Good Afternoon!
Even though the housing market is hot, trends have emerged that confirm that it is starting to cool.
Cracks Appearing
Trends are developing which demonstrate that the six-year housing run is beginning to cool.
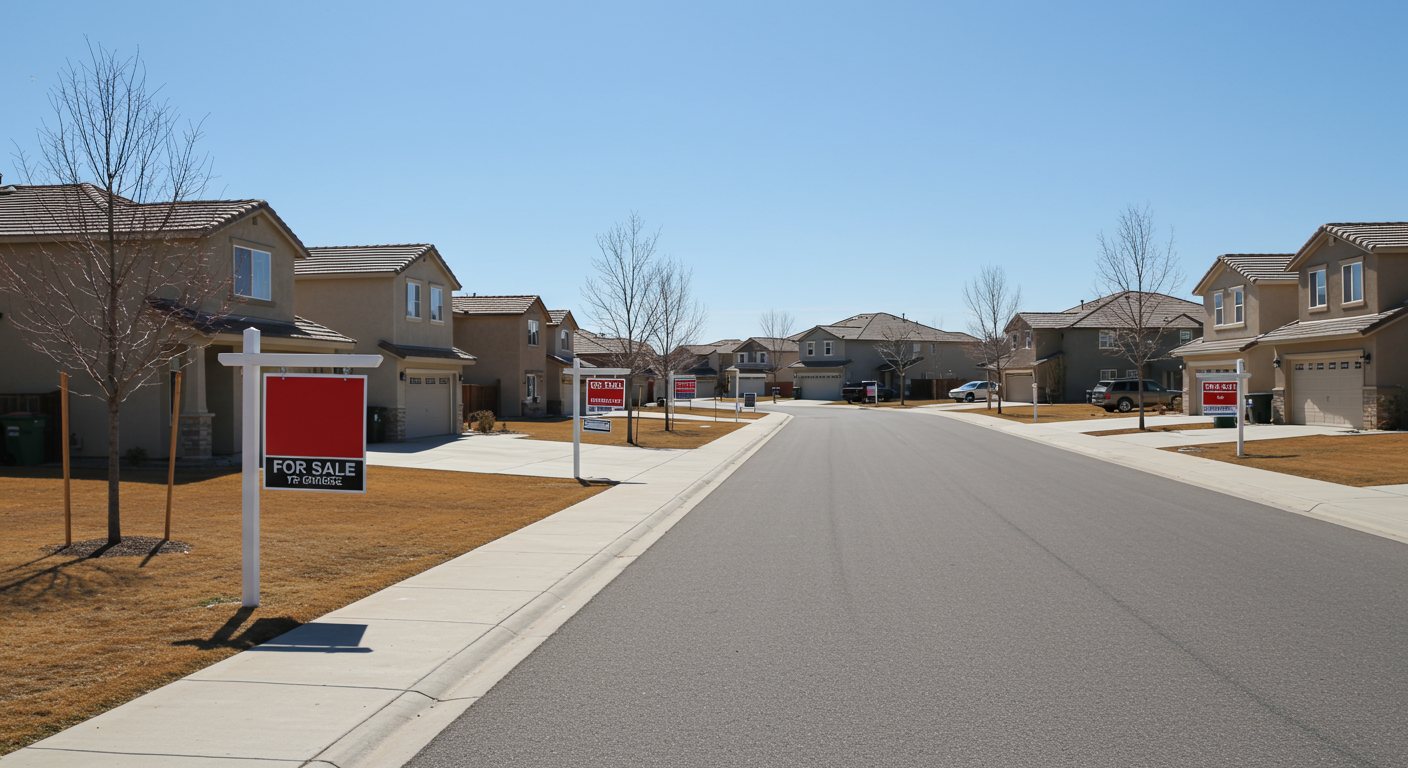
Headlines are the same across the country: there are not enough homes on the market and buyers are having an extremely difficult time finding a home It has been a supply and demand issue for more than six years now, dating back to 2012. The story has not changed much for quite some time; that is, until now.
Now that a third of the year is in the rearview mirror, noticeable cracks have appeared that illustrate a cooling market. It is not as if housing has suddenly tilted in favor of buyers. No, there are still multiple offers and plenty of homes flying off the market and into escrow just moments after the FOR SALE sign is pounded into the front yard. Buyers are still frustrated by the lack of available homes on the market below $1 million. Sellers are still in the driver’s seat. Nonetheless, trends have surfaced that highlight a cooling marketplace.
Crack – This is the first time there are more homes on the market compared to the prior year since August 2016. For 20 consecutive months, the year-over-year active inventory comparison had been less. That just changed. There are 47 more homes today compared to one year ago. On New Year’s Day, there were 674 fewer homes on the market compared to January 1, 2017. As the year rolled along, the difference diminished over time.
Crack – The current active inventory has increased by 15% in the past month. After a rather dismal, anemic start to the year, the active inventory in Orange County has been surging, adding 726 homes in just four weeks. That is the largest one-month gain since July 2013. There are currently 5,434 homes on the market, well below the 8,000 home long-term average; yet, the current trend is for a rapidly increasing active inventory.
Crack – Demand is at its lowest level for this time of the year since 2008. Demand, the number of pending sales over the prior 30 days, has been muted since the start of the year. There are simply far fewer pending sales compared to the past several years. The difference has been substantial over the past six weeks. Year over year, demand is down 11%, that is 2,675 pending sales compared to 3,012. Typically, during the Spring Market, pending sales activity is firing on all cylinders, the busiest time of the year. Yet, demand has not been this low for a start to May since 2008 when it measured only 2,540 pending sales.
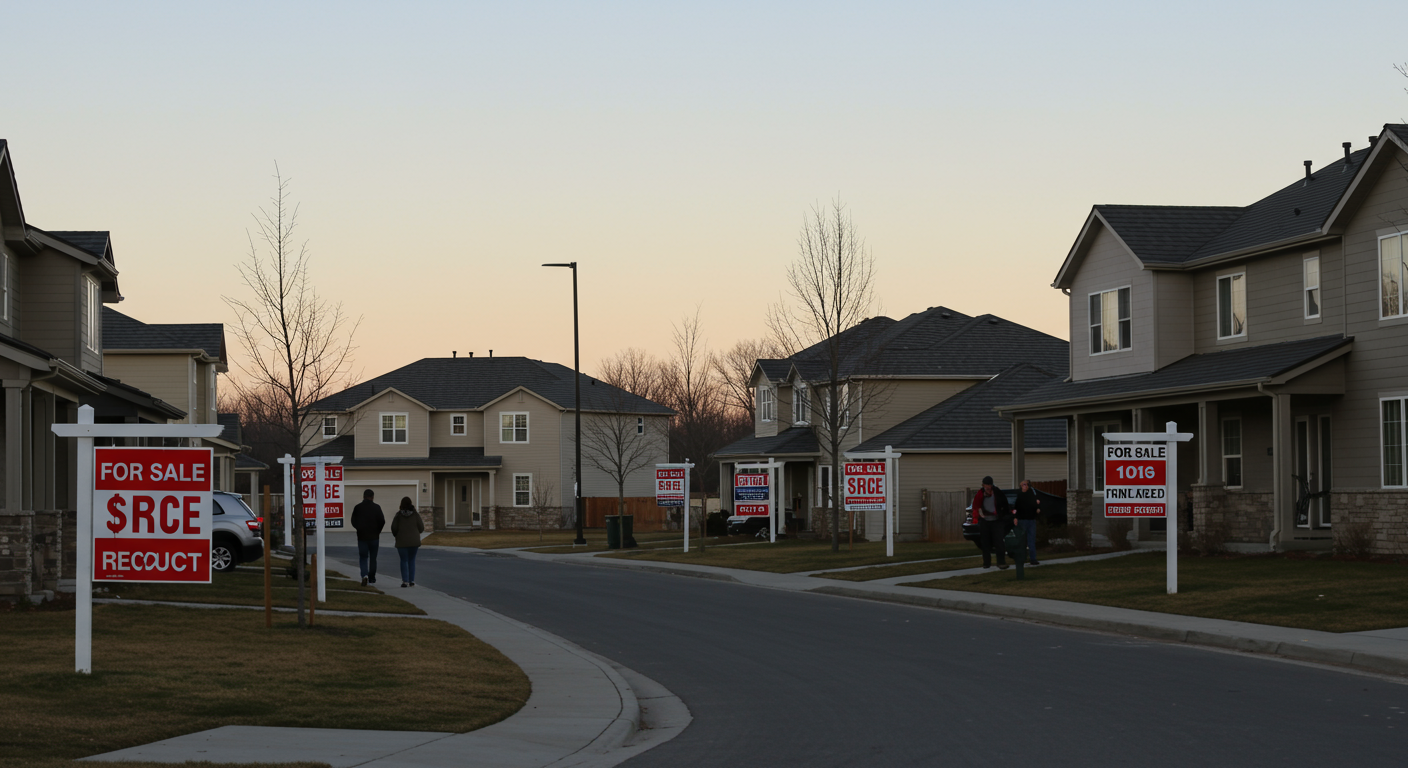
Crack – A staggering 11% of all active listings reduced their asking price within the last week. The Multiple Listing Service (MLS) has a helpful red arrow pointing downward adjacent to the asking price if the asking price was reduced. In bringing up a list of homes across Orange County, there are a lot more red arrows pointing down compared to the past several years. This phenomenon is indicative of a market inundated by overpricing. Many sellers are arbitrarily pricing and not relying on the expertise of real estate professionals, so, to be successful, they have to reduce the asking price, often more than once.

While there are definite cracks in the over-six-year housing run, the market is still a seller’s market. It is just not as hot as the Spring of 2017. These trends have only developed this year. They are cautionary flags in approaching the local housing market. If these trends continue, the market will only cool further, but it will take time. The housing market will not change overnight. This year still promises to be a very good year for sellers, only a bit more challenging, which necessitates a more cautious, deliberate strategy and approach to the housing market.
Crack – Like Orange County, all of Southern California, as a whole, is experiencing more homes on the market compared to last year, and a lot less demand. The active inventory is up for all of Southern California for the first time since May 2015. Most counties are experiencing a higher active inventory compared to the prior year. All counties are currently facing far less demand compared to last year. The bottom line: the trend of a cooler market is not just isolated to Orange County. It is affecting all of Southern California.
Active Inventory
The active inventory added 6% more homes in the past two weeks.
The active listing inventory continued its swift climb in the past two weeks, adding 290 homes, up 6%, and now totals 5,434, its highest level since September 2017. Expect the inventory to continue to climb as the market moves deeper into the Spring and Summer Markets, peaking sometime between July and August.
Demand
Demand increased by only 1% in the past two weeks.
In the past two weeks, demand, the number of pending sales over the prior 30 days, increased by a paltry 35 additional pending sales. It now totals 2,675, the lowest demand reading for this time of the year since 2008. This lower demand level will affect the number of future closed sales for Orange County in comparison to the last few years.
The expected market time, the amount of time it would take for a home that comes onto the market today to be placed into escrow down the road, increased from 58 days to 61 in the past two weeks, transitioning from a hot, seller’s market, to a slight seller’s market (less appreciation, but sellers still get to call the shots). Last year at this time, the expected market time was 54 days, a bit hotter than today.
Luxury End
The luxury inventory and luxury demand both increased in the last couple of weeks.
In the past two weeks, demand for homes above $1.25 million increased by 41 pending sales, up 11%, and now totals 412. The luxury home inventory increased from 1,974 homes to 2,025, up 3%. Year over year, luxury demand is up by 14 pending sales or 4%, and the active luxury listing inventory is up by an additional 138 homes or 7%. With a surge in luxury demand, the overall expected market time for all homes priced above $1.25 million decreased from 160 days to 147 days over the past two weeks. Last year the expected market time was at 142 days.

Orange County Housing Market Summary
For homes priced between $1.25 million and $1.5 million, the expected market time decreased from 104 to 92 days. For homes priced between $1.5 million and $2 million, the expected market time decreased from 129 to 121 days. For homes priced between $2 million and $4 million, the expected market time decreased from 208 days to 182. For homes priced above $4 million, the expected market time increased from 386 to 456 days. At 456 days, a seller would be looking at placing their home into escrow around the start of August 2019.
- The active listing inventory increased by an incredible 290 homes in the past two weeks, up 6%, and now totals 5,434. Expect the inventory to increase from now through mid-Summer. Last year, there were 5,387 homes on the market, 47 fewer than today.
- This year, 20% fewer homes have come on the market below $500,000 today compared to last year, and there have been 27% fewer closed sales so far this year. Fewer and fewer homes and condominiums are now priced below $500,000. This price range is slowly vanishing.
- Demand, the number of pending sales over the prior month, increased in the past two weeks by 35 pending sales, up 1%, and now totals 2,675. Last year, there were 3,012 pending sales, 13% more than today.
- The average list price for all of Orange County remained at $1.7 million over the past two weeks. This number is high due to the mix of homes in the luxury ranges that sit on the market and do not move as quickly as the lower end.
- For homes priced below $750,000, the market is HOT with an expected market time of just 39 days. This range represents 35% of the active inventory and 55% of demand.
- For homes priced between $750,000 and $1 million, the expected market time is 49 days, a hot seller’s market (fewer than 60 days). This range represents 18% of the active inventory and 23% of demand.
- For homes priced between $1 million to $1.25 million, the expected market time is 81 days, a slight seller’s market (between 60 and 90 days).
- For luxury homes priced between $1.25 million and $1.5 million, the expected market time decreased from 104 days to 92. For homes priced between $1.5 million and $2 million, the expected market time decreased from 129 days to 121. For luxury homes priced between $2 million and $4 million, the expected market time decreased from 208 days to 182. For luxury homes priced above $4 million, the expected market time increased from 386 to 456 days.
- On the luxury end, all homes above $1.25 million, account for 37% of the inventory and only 15% of demand.
- The expected market time for all homes in Orange County increased from 58 days to 61 in the past two weeks, a slight seller’s market (from 60 to 90 days).
- Distressed homes, both short sales, and foreclosures combined, make up only 0.8% of all listings and 1.2% of demand. There are only 20 foreclosures and 24 short sales available to purchase today in all of Orange County, that’s 44 total distressed homes on the active market, up one in the past two weeks. Last year there were 81 total distressed sales, 84% more than today.
- There were 2,614 closed residential resales in April, down by 2% from April 2017’s 2,677 closed sales. April was nearly identical to March 2018’s closings. The sales-to-list price ratio was 98.7% for all of Orange County. Foreclosures accounted for just 0.5% of all closed sales, and short sales accounted for 0.6%. That means that 98.9% of all sales were good ol’ fashioned sellers with equity.
Have a great week.
Sincerely,
Steven Thomas
Quantitative Economics and Decision Sciences
Steven Thomas
Quantitative Economics and Decision Sciences